Traffic Numerical Solutions - GIS animations (*):


Piazza Re di Roma


 Consider the following portion of urban network: Piazza Re di Roma, studied as graph composed by 24 arcs and 12 nodes.

 Approximate solutions are computed by Godunov's method with suitable boundary conditions at junctions.


  • Density value at the incoming boundary 0.1


  • Density value at the incoming boundary 0.3


  • Salerno area


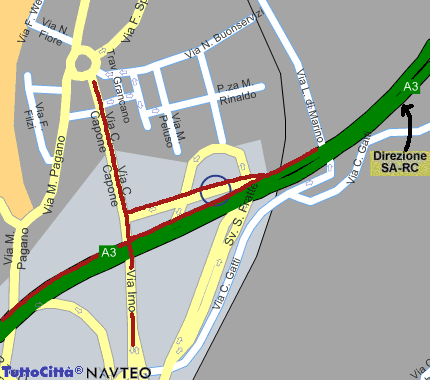
        Here we present two simulations for a portion of network in the Salerno area, namely the segment Salerno-Fratte
        of the A3 highway. Simulations reported below show how different settings of "right of way" parameters affect
         the behaviour of traffic.


  • Animation 1

  • Animation 2


  • Below is reported a simulation of the entire network of Salerno.


  • Network of Salerno


  • Viale del Muro Torto


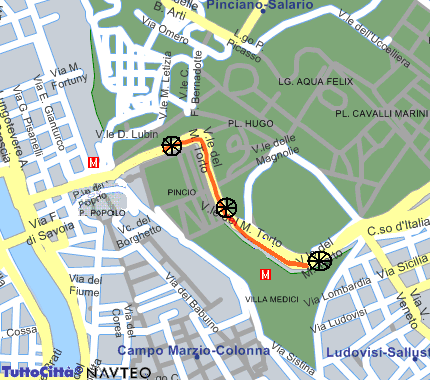
        Let us consider another portion of urban network of Rome, namely Viale del Muro Torto in the direction from
        Corso d'Italia towards Piazza del Popolo. We compute approximate solutions starting from an empty configuration
        and using as boundary data experimental data provided by the municipal society for traffic monitoring and control
        of Rome, namely ATAC S.p.A.
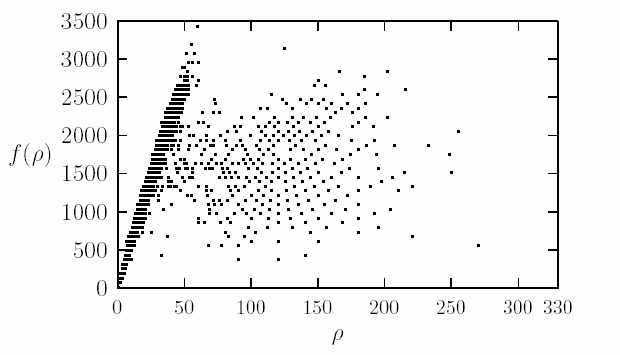
        Traffic is observed through sensors located along roads of some areas of the city, which acquire every minute traffic
        data such as flux,velocity and occupation rate. Approximate solutions are computed by Godunov's method with
        boundary conditions given by measured data.


    In the Figure above is represented the density-flux diagram of measured data.


  • Evolution in time of density from 6:00 to 10:00.


  • Evolution in time of density from 16:00 to 20:00.