Examples
Traffic light
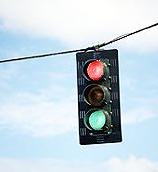
We consider the case of a single road of length 2 with a traffic light in the middle. We assign the initial and boundary data.
On the left endpoint of the road the density comes in (boundary datum), while on the right we assume a Neumann condition.
At t=0 the light is red and the two phases of the traffic light (red and green) are equal.
The traffic light cycle (red+green) is t=2.
The initial density is u0(x)=0.3 and the boundary data is u1(t)=0.5, corresponding to the maximum flux.
Animation 1a: T = 2, Godunov's method
Animation
1b: T = 2, first order kinetic method(2 velocities)
Animation
2a: T = 4, Godunov's method
Animation
2b: T = 4, first order kinetic method(2 velocities)
Animation
3a: T = 20, Godunov's method
Animation 3b: T = 20, first order kinetic method(2 velocities)
Two traffic lights.
Here we consider the case of a single road of length 3, where we have a sequence of two traffic lights. The first traffic light is placed at x=1,
while the second is placed at x=2. Initial data and boundary data are imposed as for a single traffic light. The interest of this case is represented
by the interactions of waves produced by the two traffic lights.
Here we use the Godunov's approximation method.
Animation 1: T = 10, initial data u0(x) = 0, boundary data u1(t) = 0.15
Animation 2: T = 20, initial data u0(x) = 0, boundary data u1(t) = 0.15
Animation 3: T = 40, initial data u0(x) = 0, boundary data u1(t) = 0.15
Animation 4: T = 10, initial data u0(x) = 0, boundary data u1(t) = 0.45
Animation
5: T = 20, initial data u0(x) = 0, boundary data u1(t) = 0.45
Animation 6: T = 40, initial data u0(x) = 0, boundary data u1(t) = 0.45
Single junction: 4 roads
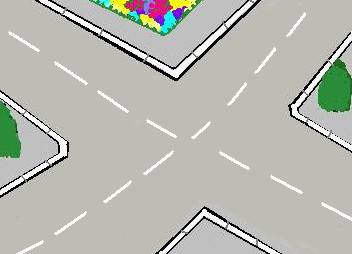
The junction is composed by 2 incoming roads, road 1 and road 2, and by two outgoing roads, namely road 3 and 4.
Animation 1: little perturbation on the road 1 (T = 240)
Animation 2: perturbation on the road 1 (T = 80)
Traffic circle: 8 roads, 4 junctions
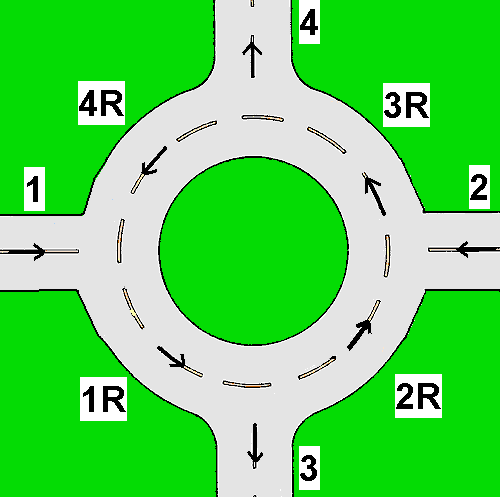
We consider a simple network representing a traffic circle formed by 8 roads:
4 roads compose the circle (1R, 2R, 3R, 4R) and the other four roads are divided into incoming in the circle (road 1, 2) and outgoing (road 3, 4).
Here the approximate solutions are produced with the Godunov's method.

In the following animations we consider the network initially empty.
Animation 1: The density entering from the incoming roads is u1 = 0.25 (it corresponds to a medium flux); the right of way parameter is q = 0.75
Animation 2: The density entering from the incoming roads is u1 = 0.45 and it corresponds to high flux; the right of way parameter is q = 0.25
Animation 3: The density entering from the incoming roads is u1 = 0.45 and it corresponds to high flux; the right of way parameter is q = 0.75
Animation 4: The density entering from the incoming roads is u1 = 0.1 and it corresponds to a low flux; the right of way parameter is q = 0.5
Animation 5: The density entering from the incoming roads is u1 = 0.25 (it corresponds to a medium flux); the right of way parameter is (p = 0.5)
Now we assume the following initial and boundary data:
u1(0,x)=u1(t,0)=0.25, u2(0,x)=u2(t,0)=0.4, u3(0,x)=u4(0,x)=u1R(0,x)=u2R(0,x)=u3R(0,x)=u4R(0,x)=0.5.
Animation 6: traffic jam: right of way parameter q = 0.25
Animation 7: traffic jam: high flux (u1 = 0.45) with the right of way parameter q = 0.75
Bottleneck.
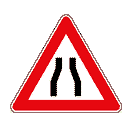
A bottleneck is a road characterized by a narrow passage that can provoke a point of congestion. We represent it as a single junction composed by road 1
(the largest) and road 2 (the narrowest). The different capacity of the roads is modeled by using two different flux functions on each road.
The approximation was produced by the 3-velocities kinetic method of second order.
In the following animations we consider the network initially empty: initial data u1=0=u2.
Animation 1: The boundary value of the density entering from road 1 is equal to 0.66, which corresponds to maximum density that can be absorbed by road 2, the observation time is T=8 and the space step is h=0.00625.
Racetrack


